


Commodities Update – 19th January 2015
January 19, 2015Monday 19th January 2015 – 14.15
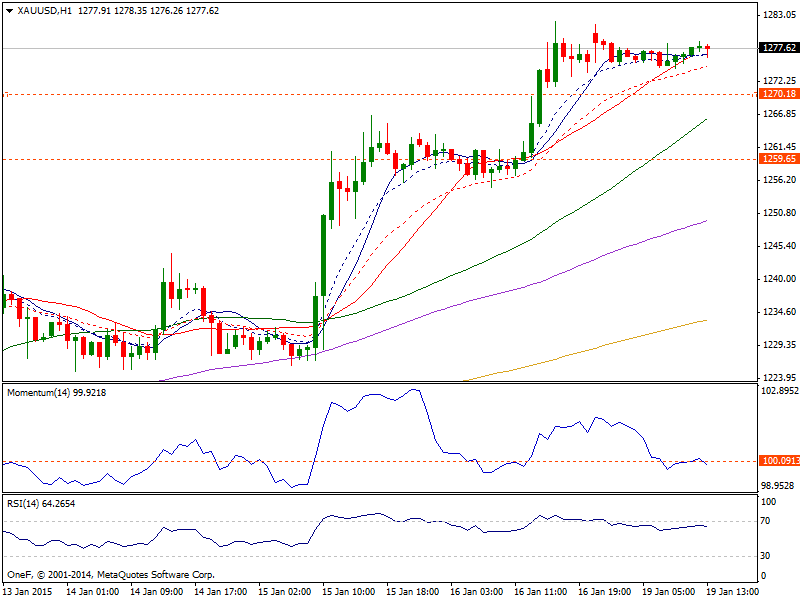
Gold: Gold climbed to a new 2015 high at $1282 after the SNB shook the markets when they abandoned their support of the currency. It initially pushed lower on Friday, but found enough support at the $1260 level to turn things around and break higher. This recent high coincides with an overbought reading in its RSI indicator and has since resulted in a pullback, which could see a re-testing of previous downside support at $1270 before continuing a bullish trend targeting a fresh high of $1293. We also wouldn’t be surprised to also see this market test the $1400 resistance level now citing the possibility for more stimulus in Europe and speculation the Fed will delay raising interest rates. However should support fail to hold the next clear downside level is likely to be seen at gold’s 50 SMA, currently trading at $1264. Hence, we are buyers every time the market dips and have no interest in selling.
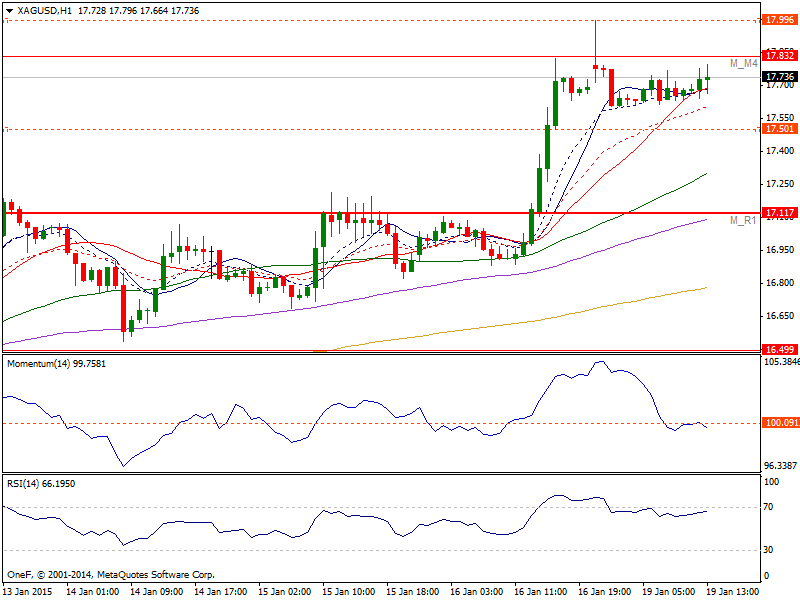
Silver: Silver soared to $17.813 on Friday following the uptrend in gold as geopolitical instability and the move by the SNB sent investors to precious metals. It broke above the $17.50 level which of course was resistance and now see the $18 level above as being resistance as well, but if we can get above there we feel that this market should eventually break out to much higher levels and given enough time send this market to the $19 and $22 level respectively. Silver prices are currently consolidating around a key level of topside resistance at $17.70, which if held could well see a re-testing of its 50-hour moving average, currently placed at $17.26. However, should a pullback from an oversold reading spark a resumption of the bullish trend, a re-testing of the previous high of $17.97 could be brought into play. We are buying on pullbacks now and believe that this market is in fact starting to show massive bullish pressure and have no interest in selling as there is so much in the way of support.
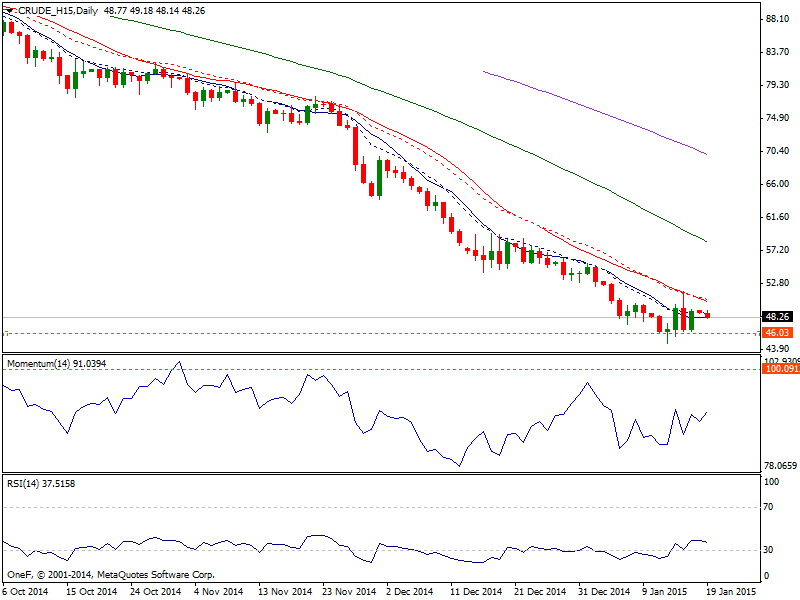
WTI: WTI went back and forth in a very volatile week as we remain below the $50 level. It rose during the course of the session on Friday, bouncing off the $46 level yet again. Also hanging over oil prices is the possibility of monetary easing from the ECB, which if seen is likely to see a move higher in the value of the US dollar, thus add further pressure on oil prices. Technically in the 4 hours chart price holds above its 20 SMA ever since regaining in last Thursday, whilst indicators bounced from their midlines and maintain an upward slope, supporting at least a retest of recent highs around 51.70. On the other hand if we break down below $44 which of course is the lows of the range, this market will more than likely continue down to the $40 handle.
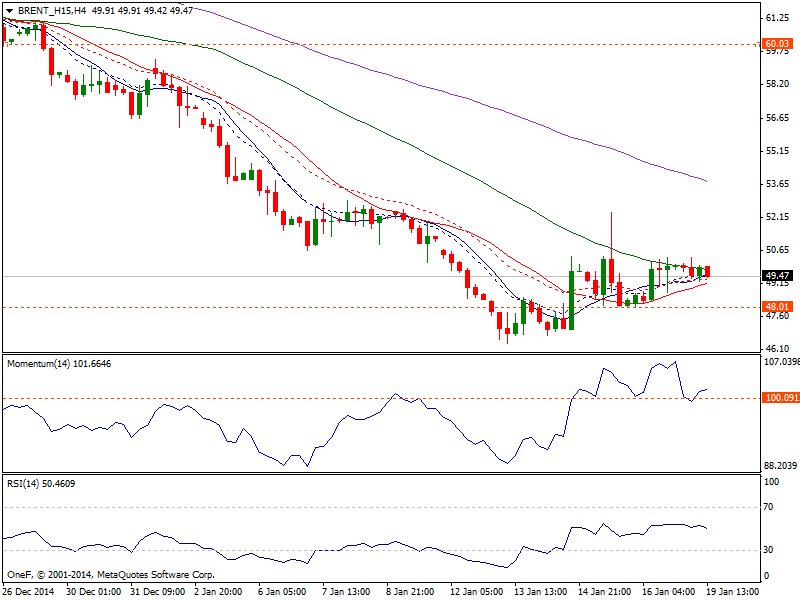
Brent: Brent rose during the course of the session on Friday with the $48 level as support. The market looks like it’s ready to grind sideways but we should be aware of the fact that the weekly candle is actually a hammer. So if we can break the top of the shooting star from the Thursday session, we feel that this market could probably go all the way back to the $60 level given enough time. The question then becomes whether or not it is simply a bounce or has the market done selling off altogether? It’s a little early to suggest that its going to happen, but there is a real threat of some type of massive bounce now. After all, there aren’t that many people left to sell this market as it has been sold off so viciously. Ultimately a break above the top of the hammer is a buying opportunity as far as we can see, as long as you can handle the volatility!
Natural Gas: Natural Gas tried to break higher last week, testing the $3.35 level. We managed to find resistance in that area based upon the gap from a couple of weeks ago, forming a candle thus we feel that this market should continue to drop, but we need to see a resistant candle in order to start selling. The $2.80 level below is massively supportive, so we feel that the market should aim for that level again and perhaps even break below there given enough momentum.


