Daily Market Update – 16/02/15
February 16, 2015Monday 16th February 2015 – 09:30
Last week saw new all-time highs on both the German DAX and the S&P500 as investors focussed on much better than expected GDP numbers from around Europe, as well as a newly signed ceasefire agreement between the Ukrainian government and Russian separatist forces in the east of the country, helped foster a new feeling of optimism amongst European investors. It is also round two of the bout between Greece and its major creditor, the EU, today as the Eurogroup meeting again convenes to try to thrash out some sort of deal that would be agreeable to all sides on how to prevent a “Grexit”. The signs are reasonably positive as the meeting approaches amid reports that Greece is willing to be more open to the negotiations this time around. Tsipras says he’s “confident” about progress in renegotiating Greece’s debt at a crucial Eurozone meeting. The left-wing government of debt-hit Greece wants to end a punishing austerity program agreed to by their center-right predecessors in return for international bailout funds. “We don’t need money, we need time to realize our reform plans,” Mr Tsipras was quoted as saying by German news weekly Stern on Sunday. “I promise you Greece will be a different country in six months.” Hence market sentiment is a touch cautious once again (as it was in the run up to Wednesday’s first meeting) and this could mean a rather quiet day as traders await any news.
A mix of data this week will focus on the FOMC Minutes (Wed) and the global flash PMI’s (Fri), with the German/EU ZEW Economic Sentiment Survey being the main event likely to drive any direction today. With the US out for the partial Presidents Day holiday, it could be a largely range bound affair to start the week with a number of other factors this week also likely to keep investors on their toes, including the latest minutes from the FOMC and the Bank of England, along with the latest UK inflation, unemployment and wages numbers. Chinese New Year, beginning later in the week, will add to the thin liquidity in Asia.
EUR/USD: The EUR/USD pair fell slightly during the session on Friday, as the market continues to grind away below the 1.15 handle. We look at this is the massive resistance that the market is trying to find its way to, and as a result we would like to see this market go a little higher in that it would test more significant resistance that we have seen on Friday. Ultimately, any resistive candle between here and there should be a nice selling opportunity and we believe that the EUR/USD is most certainly still in a very negative downtrend.

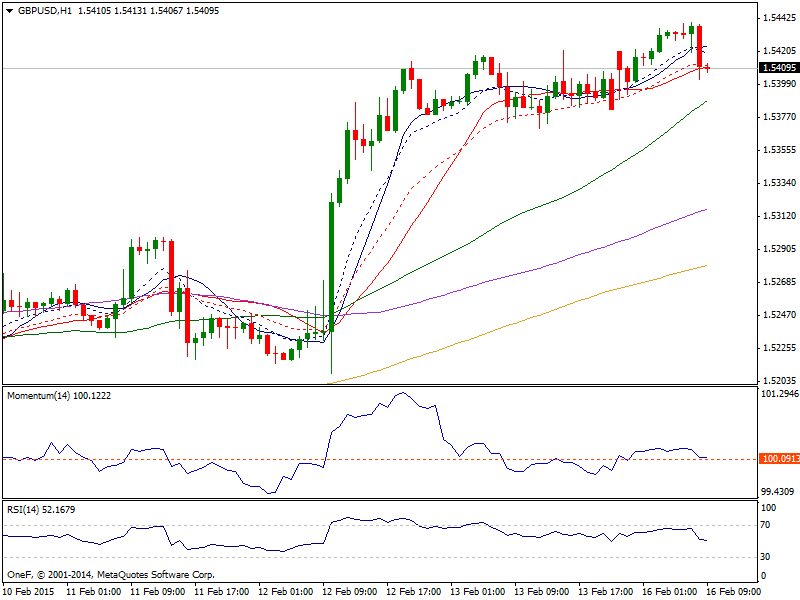
GBP/USD: Cable retains an underlying bid tone which could yet see further gains above the 1.5420 high, where the next targets would be the Fibo resistance at 1.5460 (76.4% of 1.5620/1.4950) and then the major Fibo level at 1.5473 (23.6% of 1.7191/1.4950). Beyond this would look at 1.5500, above which it all gets rather messy given the previous consolidation in the 1.5500/1.5620 area, and any upward momentum could begin to slow. If Cable fails here at 1.5400, then we could see a return to Friday’s 1.5370 low and then to minor support at the 6 Feb 1.5351 high, below which would return to Fibo support at 1.5300 (23.6% of 1.4987/1.5398). Below 1.5300 would see us back in the 1.5200/1.53 consolidation that has dominated trade over the last few sessions but I don’t think we are heading back towards 1.51/1.500 for a while now.
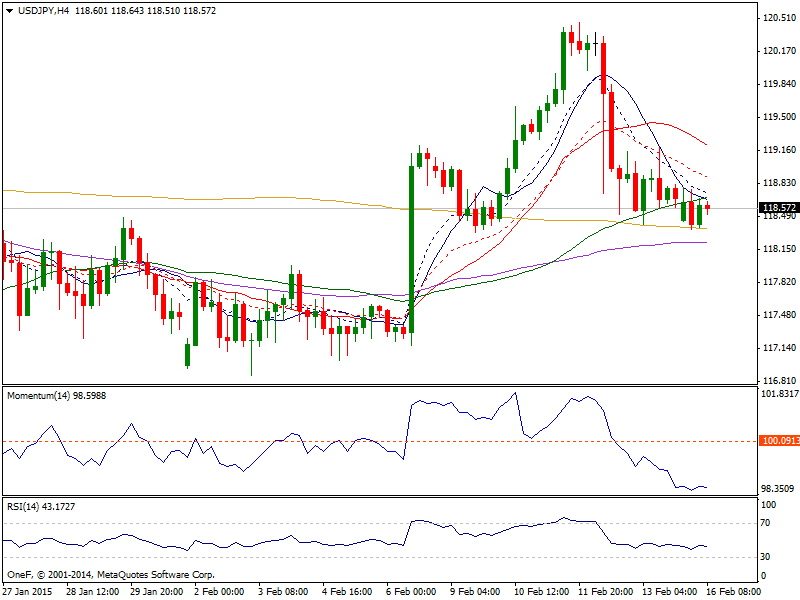
USD/YEN: The USD/YEN pair tried to rally on Friday, but struggled as you can see. The market ended up forming a shooting star, which is of course bearish. However, the market is still bullish as far as its bias at the moment and as a result we are looking to buy pullbacks. A break above the shooting star is also a buying opportunity as well and as a result we are “buy only.” The area below is really noisy, so we would expect a lot of support below and as a result we think that the buyers will come back sooner or later.
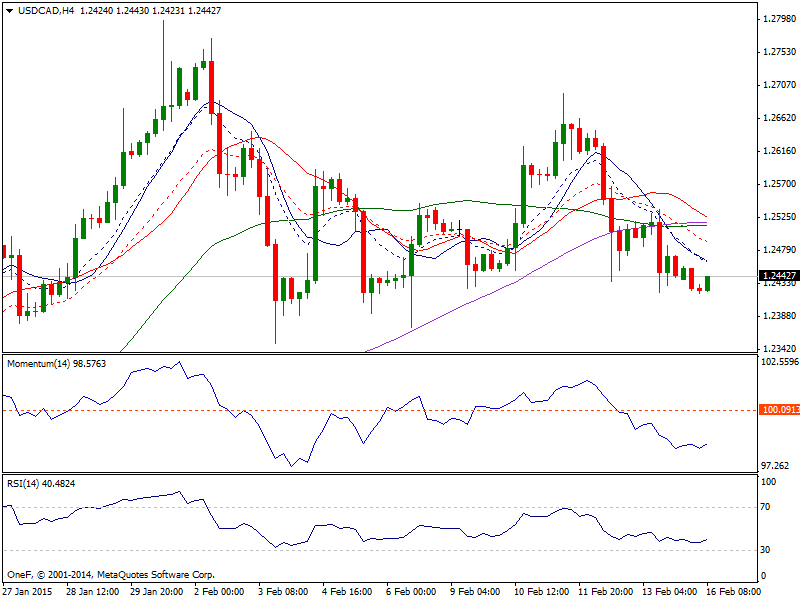
USD/CAD: The USD/CAD pair tried to rally at first during the session on Friday, but failed and formed a negative candle in the end. The market is well-supported just below, and as a result we are buyers on supportive candles. However, the weekly candle is a shooting star, so there could be a bit of a fall from here. The market looks as if there is a massive amount of support at the 1.20 level as well, and this should be the “floor” in this pair at the moment. We are bullish overall, and are not looking to sell, even with the breaking down of the 1.24 level.
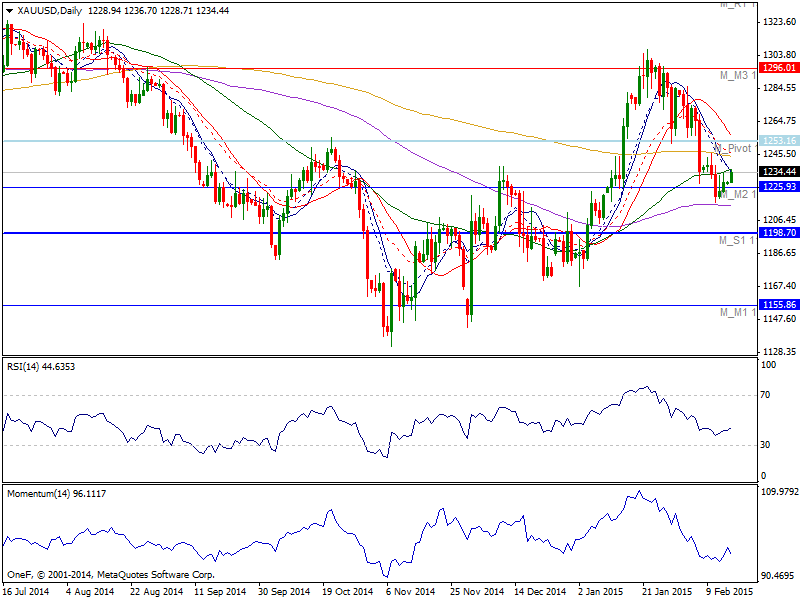
Gold: There is nothing new to report on Gold after it remained in its familiar range (1221/1235) on Friday, once again propped up by the 100 DMA (1217) but hemmed in by decent selling interest above 1235. While the dailies pointing lower, I prefer to sell rallies, where the topside will again find sellers at 1235 and then again at 1240 although this seems unlikely to be visited today. Selling rallies, with a SL above 1255 seems to be the plan, although we need a break of 1215 in order to gain confidence of further downside momentum, where the initial support will arrive at 1190/1200. Having previously lost the support around $1222, my concerns about the medium term outlook remain and I expect the low at $1216.50 to be retested.
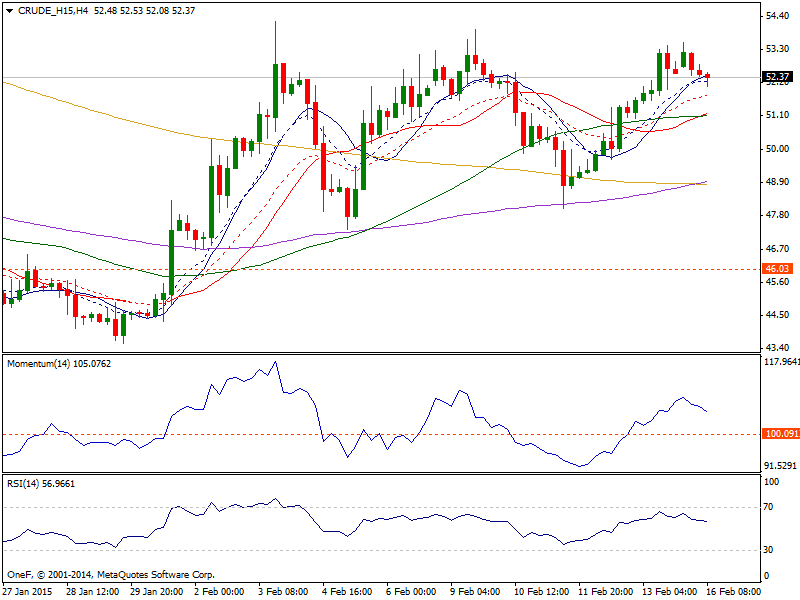
WTI Oil: In the short term, WTI continues to trade in volatile, but largely sideways fashion, although Friday did see a squeeze higher towards the top end of its recent range, reaching 53.41 before topping out and heading back towards 52.50, not too far removed from where it finished the previous week. That area is the top of the recent consolidation area and as a result it appears that we could get selling pressure. Nonetheless, there is a significant amount of noise between here and the $60 level, so really at this point time we are simply looking for resistive candles between here and there. Some type of shooting star would be a perfect signal, but any large negative candle at this point in time should continue to offer pullbacks. Ultimately though and once we get above the $60 handle we feel that this market will go much higher, as it is most certainly oversold on the longer-term charts at this point in time and there really can’t be that many people left to short the light sweet crude market anymore.