Daily Market Update – 18/02/15
February 18, 2015Wednesday 18th February 2015 – 09:30
US markets hit new records late last night on reports that Greece was looking to revive a plan reportedly put forward by Pierre Moscovici and which Greece found acceptable, which was rejected by EU finance ministers at Monday’s meeting. Of course, a deal actually has to be agreed and history teaches us that this is not the easiest thing to achieve where the euro-zone is concerned. Nonetheless, a solution would remove perhaps the key worry for the euro-zone and its stock markets, with fresh gains likely if the‘Greek ulcer’ is removed. Even though we are no closer to a deal being struck over Greece, there is a feeling that a lifeline will be cast out to save the Mediterranean nation. Athens is angling for emergency funding for its banking system and should the European Central Bank deny it, it would effectively be turning its back on the debt-laden country. Europe doesn’t want to let Greece go as it has too much at stake, given the popular discontent in countries like Spain, but at the same time it wants to save face and this is why markets believe a roundabout rescue package will be reached in the end. Financial markets are certainly looking to price in a deal now, with the S&P 500 seeing a second closing all-time high in a row, up 0.2% on the day. Asian markets were positive across the board although with several countries winding down now for the lunar New Year holidays, volumes were light. European markets have also started the day slightly stronger.
Central banks are the theme of today, with first of all the Bank of England and then the Federal Reserve releasing the minutes from their latest meetings. The BoE is expected at 0930GMT to show a unanimous vote for keeping monetary policy flat, with the risk being that perhaps either Martin Weale and/or Ian McCafferty switch back again to voting for a rate hike, which would be positive for sterling. The FOMC minutes will add more meat to the bones of the improving outlook for the US economy. The release is at 1900GMT. The other data out today includes the UK employment data at 0930GMT which importantly includes the average weekly wages growth (+1.8% expected). Also at 1330GMT there is the US Building permits (1.08m expected) and housing starts (1.07m expected).
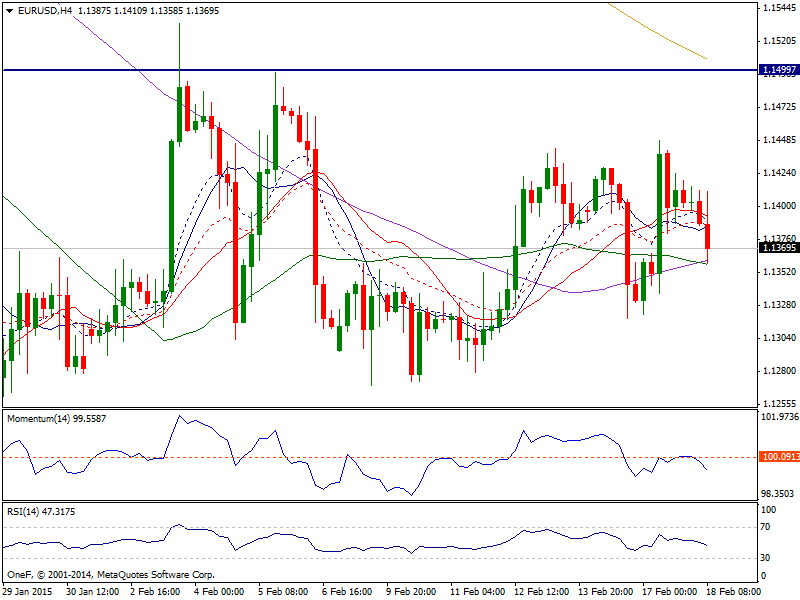
EUR/USD: The EUR/USD pair went back and forth on Tuesday, ultimately hugging the 1.14 level yet again. We believe that this market is essentially going sideways and below the 1.15 level overall as the Euro continues to have trouble in general. Because of this, we are sellers on resistive candles but don’t really have the signal quite yet. With that, we are bearish but recognize that the market may be fairly quiet of the next couple of sessions as we digest all the latest news. Ultimately though, we think this pair will test the 1.11 handle.
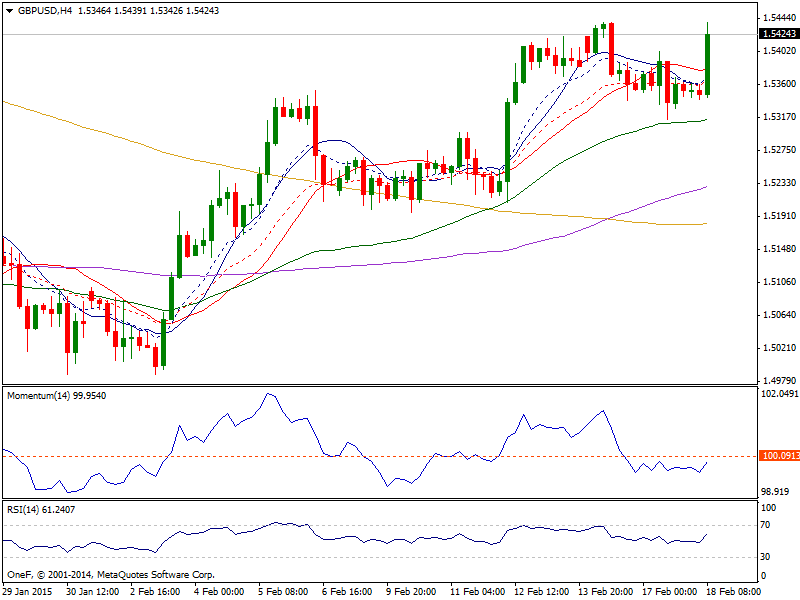
GBP/USD: The GBP/USD pair fell initially during the course of the day on Tuesday, but found enough support near the 1.53 level to turn things back around and form a bit of a hammer. I would say that the 1.53 support probably needs to now remain intact to prevent a bearish drift back towards the key support at 1.52 now, which would represent the bulls having lost control again. This of course is a positive sign, and we feel that the market is getting ready to head towards the 1.55 handle over the course of the next couple of sessions. That is an area of massive resistance though, so we are not looking for a longer-term move at this point in time, just that there is the possibility of buying the British pound over the next couple of sessions.
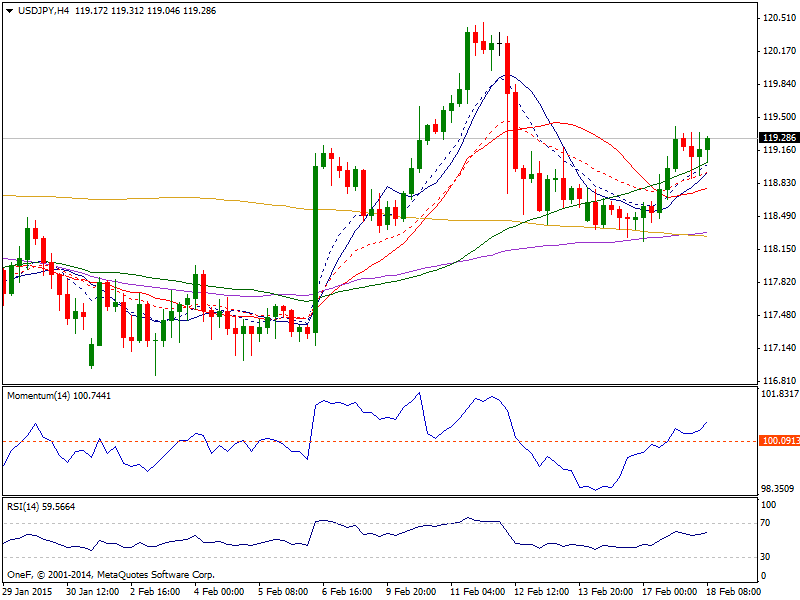
USD/YEN: The USD/YEN pair broke higher during the session on Tuesday, breaking above the 119 level. Ultimately, this market looks as if it is ready to go higher and as a result we are buyers. We believe that the pair probably goes to the 120 level next, and then perhaps the 121 level after that. Selling isn’t even a thought at this point, as the latest low was much higher than the one before it. We believe ultimately the interest-rate differential will step into play, and continue to push the US dollar higher than the Japanese yen over the longer term.
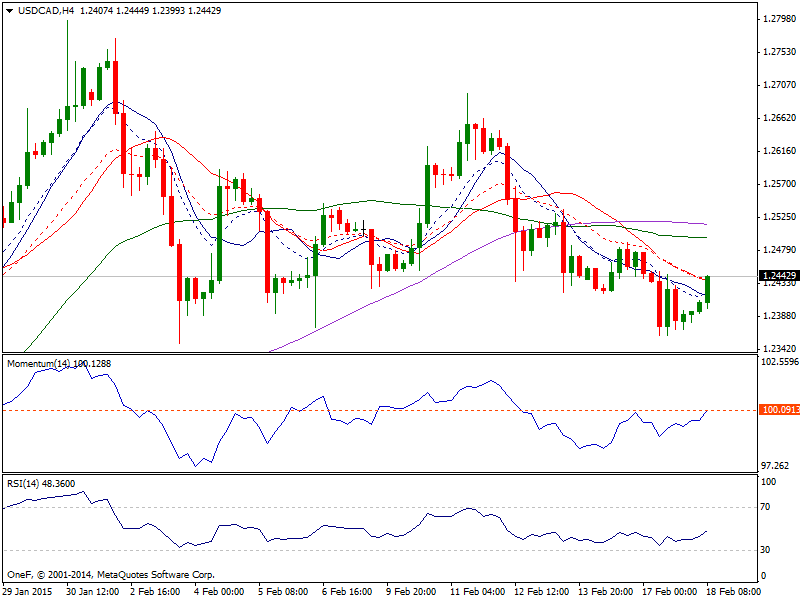
USD/CAD: The USD/CAD pair fell during the session on Tuesday, testing the 1.24 level for support. It did in fact find support there though and as a result we formed a little bit of a hammer. The hammer sits at the bottom of consolidation, so we could very well bounce from here and a move above the 1.25 level is reason enough for us to start buying. However, we do recognize that this pair can break down a little bit and start to fall looking for more support, we think that support is at the 1.20 handle and therefore we are buyers of that massive pullback if we do in fact get it. We do not have any interest whatsoever in selling this pair right now because we believe that the support sits all the way down to the 1.18 handle.
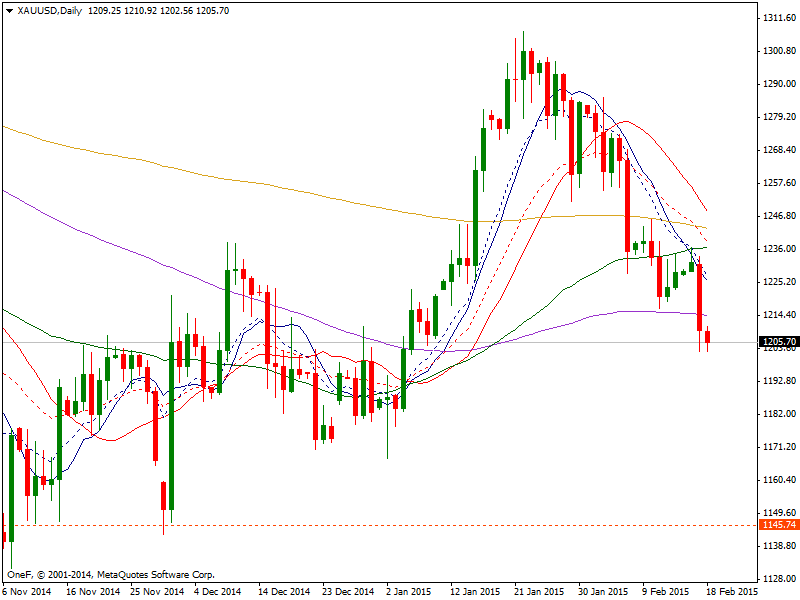
Gold: The bears made another statement of intent yesterday as the price decline now confirms my belief that the medium term outlook is becoming increasingly negative. Another strongly negative daily candle was posted as the breakdown of the Fibonacci retracement support at $1222 of 61.8% of the bull run was confirmed. This now suggests the likelihood of a full retracement to $1168 is now high. The RSI closed yesterday at its lowest level since mid-November, with Stochastics also in negative configuration. The intraday hourly chart shows a sharp fall as the support at $1216.50 gave way yesterday. This shows that this is now the overhead supply and that perhaps waiting for the gold price to just unwind slightly back towards $1216.50 would be a good chance to sell. There is around $20 of resistance up towards $1236.50. Expect further weakness to test the $1203.30 low from yesterday, but there is now not too much support until the key low at $1168.50.
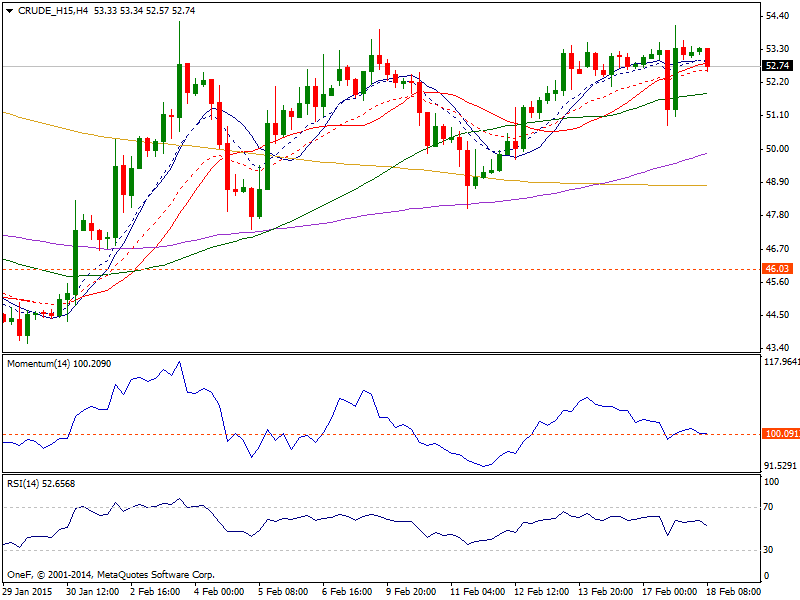
WTI Oil: WTI is still unable to make much headway above the $53 mark. So far in February, intraday gains above here have been fleeting, so we need to see a firm close above this mark to maintain the momentum that has seen the price rally by more than 14% in February. As with Brent, WTI is pulling away from its rising trendline and with the hourly RSI steadily declining, we could see a test of the $51 zone in coming days if a pullback materialises. This would provide a good entry point for those looking for a continuation of the trend.