


Indices Update – 19th January 2015
January 19, 2015Monday 19th January 2015 – 10.40am
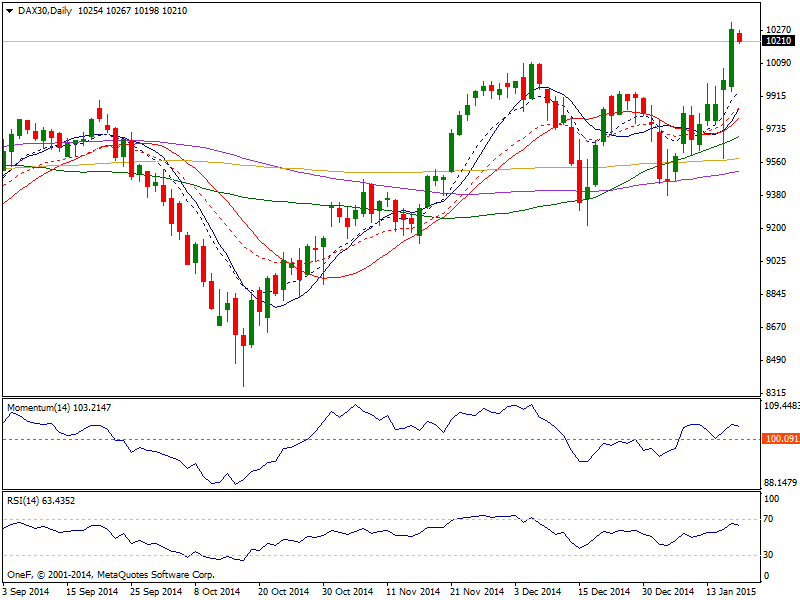
Dax: The Dax broke much higher last week clearing the hammer that formed on Thursday and pushed to fresh new highs, moving past the 10100 level as well and trading well above the 10313.50 handle. It now looks ready to maintain higher and resume the next leg up as investors are convinced the ECB will insert fresh liquidity into the markets this Thursday, betting in advance on hopes local share markets will repeat US indexes following the Central Banks move. The daily chart shows that the bullish force prevails as per indicators bouncing strongly from their midlines, with moving averages way below current levels. In the 1 hour chart indicators are losing their growing strength near overbought levels, however 20 SMA presents a strong bullish slope well below current levels supporting further advances for the upcoming days. We feel that any pullbacks will continue to be buying opportunities and that themarket will continue to go to higher up to the 10500 level based upon a lower valued Euro which of course helps exports. We have no interest in selling and as a result are essentially “buy only.”
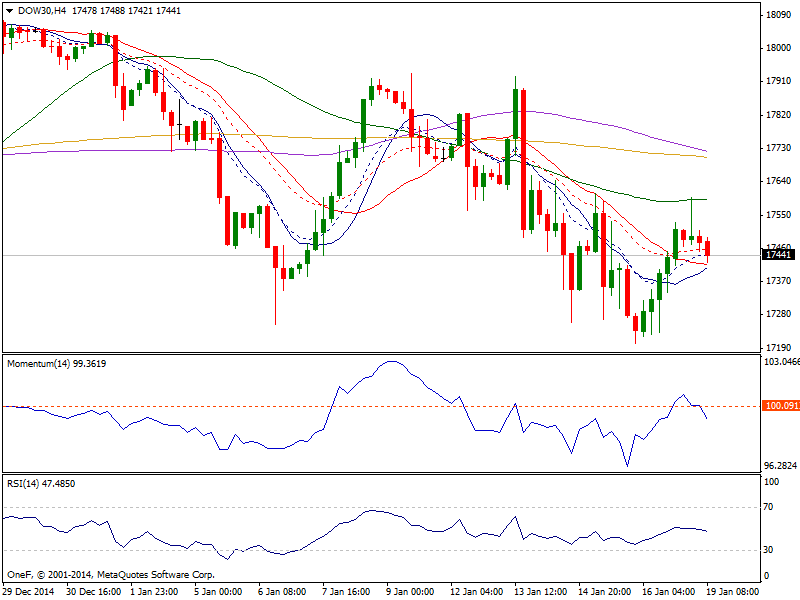
Dow: The Dow originally fell through the session on Friday but ended up forming a positive candle by the end of the day with support near the 17250 handle to turn things back around to close higher at 17511.57. It now looks as if the Dow is ready to go even higher following news from the IEA predicting drillers would reduce oil production this year plus with consumer sentiment rising to 98.2 last week, also supporting equities. However remember that it is Martin Luther King Jr. day and the markets will be closed but once we get back to trading on Tuesday, pay close attention to the way that the European markets close because they will dictate the overall trend. Technically the daily chart shows that the index found support a few points above its 200 DMA and extended its recovery back also above 100 DMA where as in the 4 hours chart the upward potential seems stronger with the index above its 20 SMA and indicators ready to cross their midlines to the upside. If thats the case, the index needs to extend above Thursdays high of 17531, to continue recovering during the upcoming sessions.
FTSE: The FTSE 100 advanced by the recovery in oil and commodities on Friday bouncing back over the 6500 level, in turn forming a nice looking hammer to close up at 6550.27. The daily chart shows that the index advanced above a bullish 20 SMA, but should it extend its advance will face a strong forceful resistance around 6565 100 DMA. Indicators in the daily chart head higher around their midlines, failing to confirm an upward continuation, while in the 4 hours chart they show a mild positive tone around their midlines, also lacking clear direction. However a break through the 100 DMA should favour an advance up to 6617 the December 29th daily high. We believe that buying pullbacks will be the way going forward as the FTSE looks set to head towards the highs out the 6900 region given enough time.


