Indices Update – 21st January 2015
January 21, 2015Wednesday 21st January 2015 – 10.50
Despite the IMF following in the footsteps of the World Bank and downgrading their global growth forecasts, equity markets have continued to push higher, driven forward by better than expected Chinese economic numbers for December, a sharply improved German ZEW economic survey and a widespread belief that tomorrow’s ECB rate meeting will see a significant amount of stimulus unleashed across Europe, as central bankers attempt to offset a deflationary price spiral as oil prices once again started to slide. The speculation that Mario Draghi will announce a quantitative easing scheme tomorrow has been growing for months, but will the easing policy be enough to satisfy the market? The original size of the bond buying scheme rumoured was €500 billion, but there have been whispers of up to €700 billion. The market suggests a €500 billion government bond buying programme would not be sufficient to stimulate economic activity and would only provide short-term relief for the euro. The EUR/USD pair has been trapped in a downward trend for nearly nine months but a small recovery is in sight should Mr Draghi’s stimulus come in at the low end of estimates. A figure closer to higher estimates might expect see a continuation of the downward trend in the pair, however. Let’s just hope Mr Draghi and the ECB don’t disappoint or things could get ugly pretty quickly!
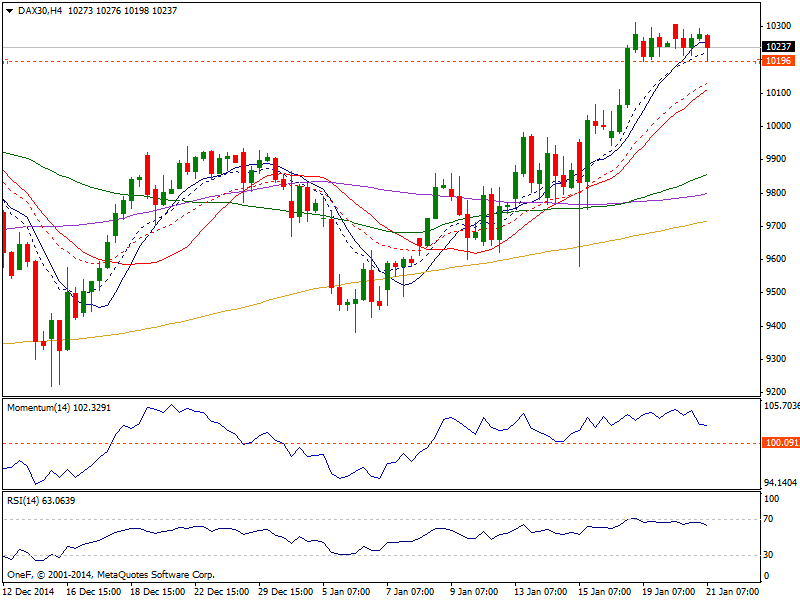
Dax: The Dax is trading in a tight range near its recent record highs and the daily chart shows that indicators lost the upward strength seen earlier this week, but remain well into positive territory. In the 4 hours chart the index develops well above a bullish 20 SMA, whilst indicators retrace some from overbought territory. A clear intraday floor has been set around 10195, meaning bulls will likely maintain the lead as long as the level holds. Nonetheless, we are still broken out and are simply looking for opportunities to go long. Pullbacks show signs of support as perfect buying opportunities as is a break above the 10300 handle. If we do get the breakout, that begins the next leg higher, extensively aiming for the 10500 level and beyond. We have no scenario in which we sell.
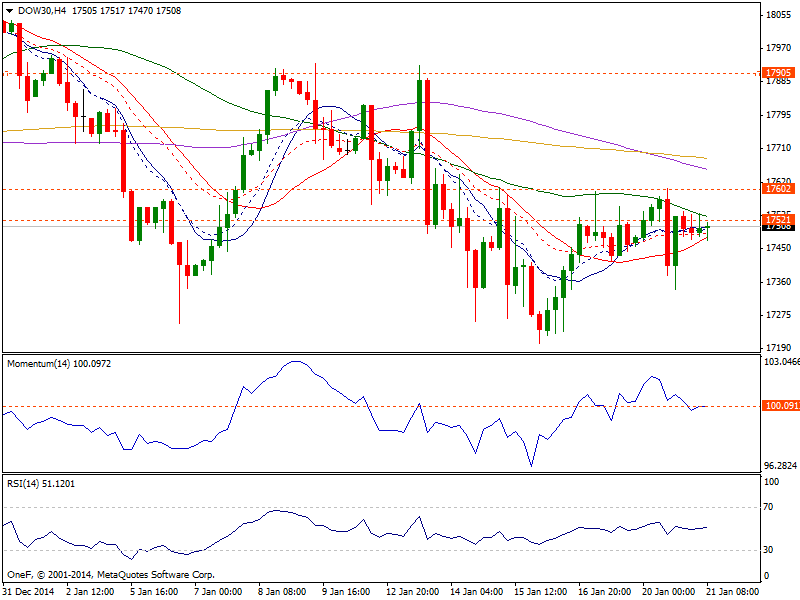
Dow: The Dow initially fell yesterday, but bounced enough to form a hammer validating the bullish motion, hence ifwe can break above the 17600 level we believe this market could in fact grind its way back to the 17900 level. Risk remains to the downside, yet some move through above 17530 area is required to confirm an intraday advance. With that, we are bullish but realize the market is essentially consolidating and understand that any rallies that show signs of failing are signs to get out and look to buy again at lower levels. We have no interest in selling.
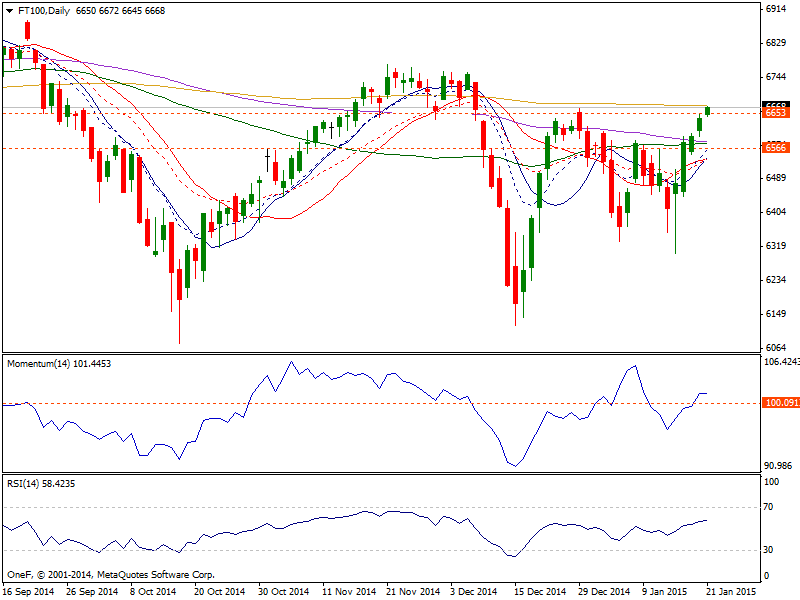
FTSE: The FTSE broke higher during the session initially on Tuesday, but struggled at the 6650 handle and ended up pulling back forming a shooting star. However, we think there is plenty of support below and look at any pullback as a potential buying opportunity. Technically the daily chart for the index shows that it closed the day above its 100 DMA, while indicators crossed their midlines to the upside and maintain a clear upward momentum, supporting further advances. If we can break above the 6650 handle, we believe that the market will then head to the 6750 level, which is where we could break out for the longer-term move higher. We don’t have any interest in selling at the moment, but do recognize that a pullback is likely.