


The Gold is ready to break the ascending trianle
May 20, 2014As I have mentioned yesterday’s post, the gold is still moving sideways and remained within the ascending triangle on a daily chart. It is getting more and more squeezed towards the corner of the triangle shown in a picture, which is giving a strong signal that, it will break the line soon.
Since yesterday, the precious metal has declined to support level of 1288.68 after traded on resistance line of 1305.05 levels. The next movement is downwards to test the 1285.25 support level.
All the moving averages (7,14,55) and, also both indicators RSI(14) and MACD (12,26,9) remaining neutral and showing a sideways movement on a daily chart.
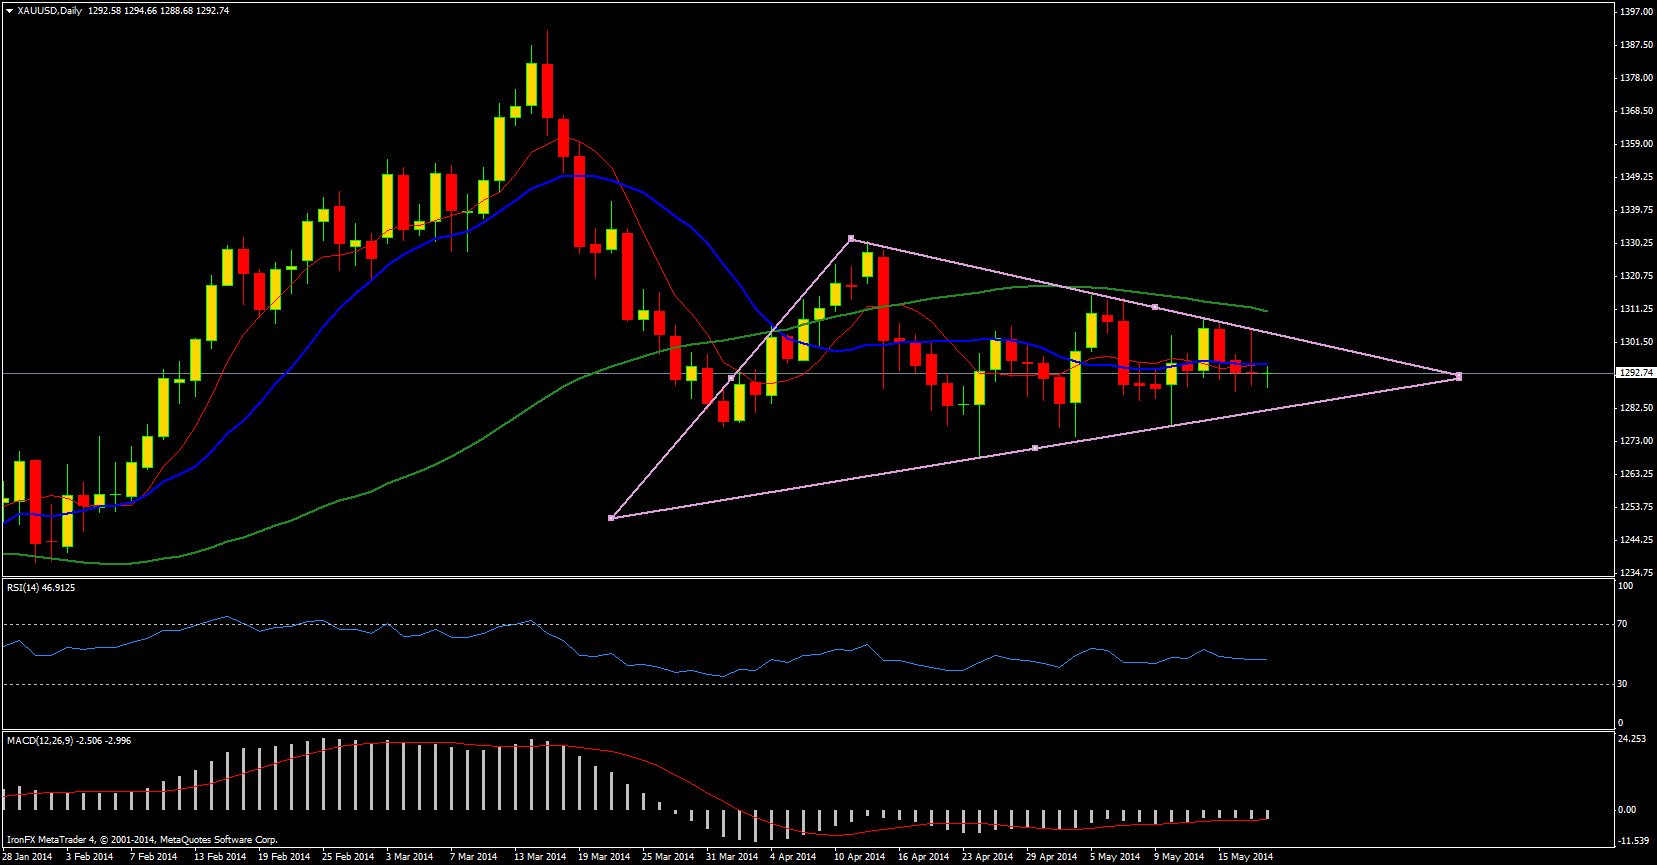
In my opinion, the price will bounce back after testing the support line, and it has expected to break the resistance trend line later today, and will follow the upwards trend.
What do you think about price movement? Looking at the picture, will it break through the upwards trend line or support line?
I would like you to share your opinions by commenting to this post.


